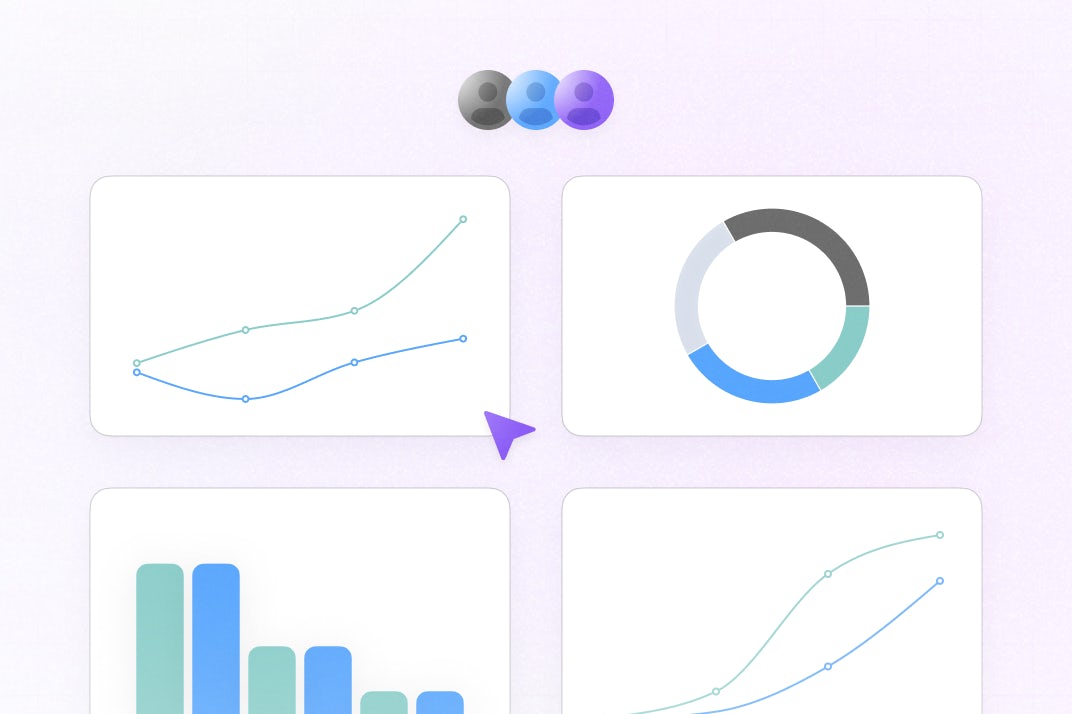
Collaborative Dashboard
This example shows how to build collaborative data visualization with Liveblocks, React and Recharts.
Getting started
Run the following command to try this example locally:
This will download the example and ask permission to open your browser, enabling you to automatically get your API key from your liveblocks.io account.
Manual setup
Alternatively, you can set up your project manually:
- Install all dependencies with
npm install - Create an account on liveblocks.io
- Copy your public key from the dashboard
- Create an
.env.localfile and add your public key as theNEXT_PUBLIC_LIVEBLOCKS_PUBLIC_KEYenvironment variable - Run
npm run devand go to http://localhost:3000
Dev server setup
You can optionally run this example locally using the Liveblocks dev server.
- Install the example as detailed above
- Run
npx liveblocks devto start the server - Add
baseUrl: "http://localhost:1153"option toLiveblocksProvider - Replace
publicApiKeyinLiveblocksProviderwith"pk_localdev" - Run
npm run devand go to http://localhost:3000
Deploy on Vercel
To both deploy on Vercel, and run the example locally, use the following command:
This will download the example and ask permission to open your browser, enabling you to deploy to Vercel. Next, you must:
- Create an account on liveblocks.io
- Copy your public key from the dashboard
- Add your public key as the
NEXT_PUBLIC_LIVEBLOCKS_PUBLIC_KEYenvironment variable in the Vercel dashboard - Run
npm run startand openhttp://localhost:3000in your browser


